No On 1 -- Maine Won't Discriminate
MAINE SAYS NO TO DISCRIMINATION!!!
- ANTI-GAY REFERENDUM FAILS
- CHALLENGES AT POLLS CAUSE DISRUPTIONS
- THIS DELIGHTFUL EDITORIAL IS A MUST-SEE!
November 5th's Maine Sunday Telegram had this extensive FEATURE STORY on the campaign and it's history.
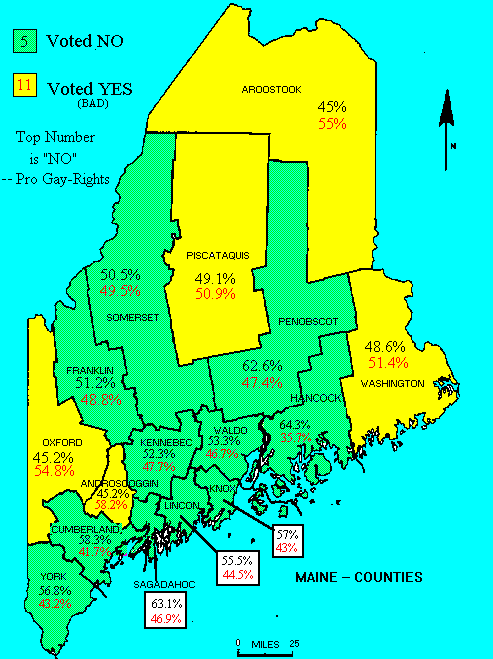
| NO (good!) | YES (bad) | PERCENT Reporting |
|---|---|---|
| 219,749 | 193,121 | 99% |
A YES VOTE IS A VOTE TO PROHIBIT / REPEAL GAY RIGHTS ORDINANCES
Large communities tip vote against Question One
Of Maine's 10 largest communities, eight voted against Question One.Only Lewiston and Auburn voted for.
| TOWN | COUNTY | YES | NO | POP. | INCOME | #/Sq. Mi. |
|---|---|---|---|---|---|---|
| Portland | Cumberland | 7,271 | 14,199 | 63,228 | $14,914 | 2,771.0 |
| Lewiston | Androscoggin | 7,025 | 5,161 | 38,042 | $12,277 | 1,107.1 |
| Bangor | Penobscot | 3,641 | 6,016 | 32,027 | $13,418 | 922.4 |
| Auburn | Androscoggin | 4,208 | 3,840 | 23,720 | $13,511 | 393.7 |
| So. Portland | Cumberland | 3,528 | 4,602 | 23,104 | $14,885 | 1,925.5 |
| Augusta | Kennebec | 2,829 | 3,290 | 20,944 | $13,209 | 376.1 |
| Sanford | York | 2,369 | 2,800 | 20,570 | $12,053 | 427.0 |
| Biddeford | York | 2,717 | 3,832 | 20,185 | $12,382 | 667.4 |
| Brunswick | Cumberland | 1,995 | 3,859 | 20,184 | $14,343 | 428.0 |
| Waterville | Kennebec | 1,861 | 3,540 | 16,744 | $12,002 | 1,221.8 |